

 ChatGPT
 Claude
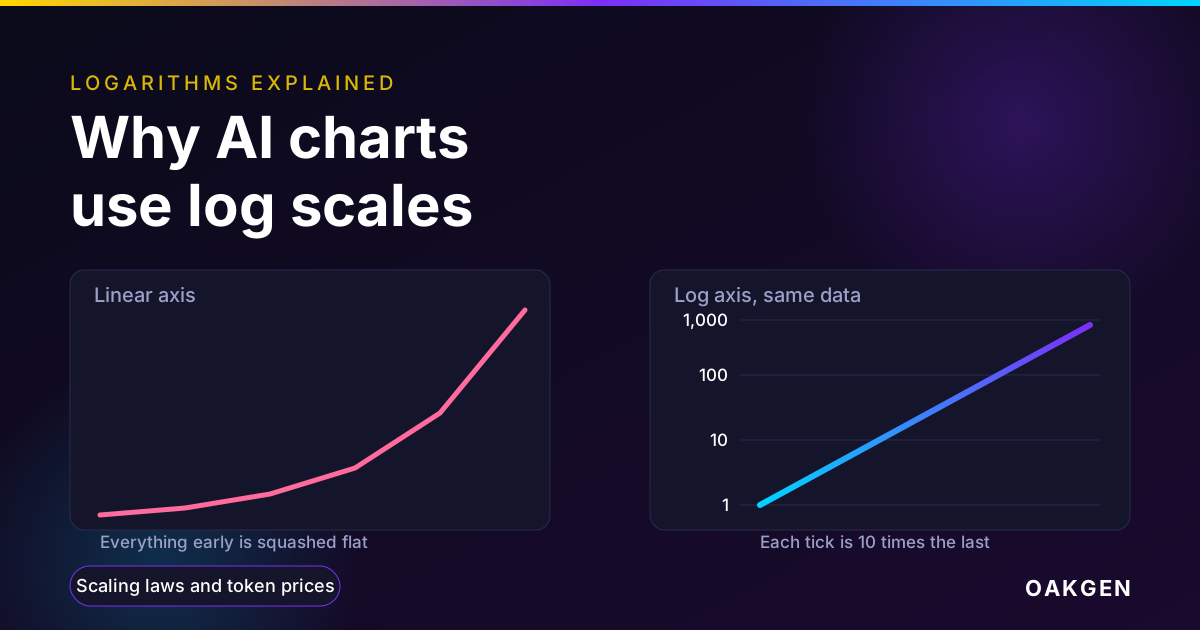
A logarithm counts how many times you multiply a base number to reach a value. The base-10 logarithm of 1,000 is 3, because 10 x 10 x 10 = 1,000. AI charts use log scales because the numbers they plot, such as training compute, price per token and context length, change by multiples and span many orders of magnitude. On a log axis every tenfold step gets the same distance, so steady multiplication draws a straight line.
The rest of this post shows the arithmetic, then applies it to the charts you will meet most often, namely the scaling-law plots in Kaplan et al. (2020) and Hoffmann et al. (2022), Epoch AI's price and context-length trends, and benchmark scores against compute.
The short version
| If the axes are | A straight line means | Typical AI example | Slope tells you |
|---|---|---|---|
| Linear x, linear y | A steady change by the same amount per step | Tokens used per day when usage grows by 1,000 a day | Amount added per step |
| Linear x, log y | Steady multiplication per step | Price per token falling by the same factor each year | Growth or decay factor per unit of time |
| Log x, log y | A power law, y = c times x^k | Language-model loss against training compute | The exponent k |
Check a model's price before you trust a price chart
Per-token charts hide what a creative job costs. Browse Oakgen's model library to see what each image, video and audio model is for and what it costs to run.
Who this is for
You have seen a chart with a diagonal line and axis labels like 1, 10, 100, 1,000, and you cannot tell whether it shows a modest trend or a dramatic one. You do not need calculus. If you can multiply by 10 and by 2, you can read every chart here.
How we checked this
As of November 12, 2026 we opened the two scaling-law papers on arXiv and read the equations and caveats we quote. We also opened Epoch AI's price, context-window and training-compute pages, plus OpenStax, Datawrapper, GraphPad and the EU Publications Office guide for the chart-reading rules.
Every worked example is arithmetic we computed in a script and double-checked. Where a table mixes arithmetic with a published number, the number carries its publisher and date and the arithmetic is labelled as ours. We did not train a model, rerun a fit or measure a price.
Disclosure: Oakgen is our product. It appears in the call-to-action boxes and one short note near the end, not as evidence for anything here.
What a logarithm is, with numbers you can check
OpenStax's college algebra text defines the base-a logarithm as "the power to which we raise" the base to get the number. In symbols, log10(x) = y means 10^y = x. So log10(1,000) = 3, log10(100) = 2, log10(10) = 1 and log10(1) = 0.
Numbers below 1 give negative logarithms. log10(0.1) = -1 because 10^-1 = 0.1. Zero and negative numbers have no logarithm, which is why a log axis can never show zero.
Base 2 works the same way. log2(8) = 3 because 2 x 2 x 2 = 8, and log2(1,024) = 10 because 2^10 = 1,024. To convert between the two, log2(x) = 3.3219 x log10(x). The factor is log2(10), the number of doublings in one tenfold step.
The table below is the first half of this post's reference asset. We computed every value with a script and checked the round ones by hand.
Table 1. Linear value to log10 and log2
| Value | log10 | log2 | How to read it |
|---|---|---|---|
| 0.001 | -3 | -9.97 | One thousandth, three tenfold steps below 1 |
| 0.01 | -2 | -6.64 | One hundredth |
| 0.1 | -1 | -3.32 | One tenth |
| 0.5 | -0.301 | -1 | Half, one doubling below 1 |
| 1 | 0 | 0 | The anchor of the axis |
| 2 | 0.301 | 1 | One doubling |
| 4 | 0.602 | 2 | Two doublings |
| 8 | 0.903 | 3 | Three doublings |
| 10 | 1 | 3.32 | One tenfold step |
| 16 | 1.204 | 4 | Four doublings |
| 100 | 2 | 6.64 | Two tenfold steps |
| 1,000 | 3 | 9.97 | Three tenfold steps |
| 1,024 | 3.010 | 10 | Ten doublings, almost exactly 1,000 |
| 1,000,000 | 6 | 19.93 | Six tenfold steps |
| 10,000,000 | 7 | 23.25 | Seven tenfold steps |
Notice the 1,000 and 1,024 rows. Ten doublings land almost on top of three tenfold steps, and that near-coincidence is why 1,000 and 1,024 get swapped so often in computing.
A 10x step is always the same distance
On a base-10 log axis the gridlines sit at 1, 10, 100 and 1,000, evenly spaced. The distance from 1 to 10 equals the distance from 100 to 1,000, because both are a factor of 10.
Datawrapper's explainer puts it in percentages. The jump from 100 to 101 is a 1% rise and 1 to 2 is a 100% rise, so the first gap is roughly 1% of the second. A log axis shows relative change, not absolute change.
Minor ticks between powers of ten are not evenly spaced. The mark for 2 sits log10(2) = 0.301 of the way from 1 to 10, and the mark for 5 at 0.699. Reading the tick after 100 as 110 is the most common slip.
How to read a doubling on a log2 axis
A log2 axis puts gridlines at 1, 2, 4, 8, 16, and each tick is a doubling. To find how many doublings separate two values, take log2 of their ratio.
Worked example. A context window grows from 8,000 tokens to 2,000,000 tokens. The ratio is 2,000,000 / 8,000 = 250. log2(250) = 7.97, so the line climbs almost exactly eight ticks. If you can count ticks, you can skip the division.
On a log10 axis the same doubling is shorter. Because log10(2) = 0.301, a doubling covers about 30% of the gap between two adjacent powers of ten. Eight doublings cover 8 x 0.301 = 2.41 decades, and log10(250) = 2.398 agrees to within rounding.
Why a straight line means something
Two rules explain every log chart in AI.
Exponential growth. If y = a x b^t, then log(y) = log(a) + t x log(b), a straight line in t with slope log(b). GraphPad's guide says it plainly. On a log y axis "exponential growth appears as a straight line".
Power laws. If y = c x x^k, then log(y) = log(c) + k x log(x). Plot log y against log x and you get a straight line with slope k.
Worked example with y = 5 x x^2.
| x | y | log10(x) | log10(y) |
|---|---|---|---|
| 1 | 5 | 0 | 0.699 |
| 10 | 500 | 1 | 2.699 |
| 100 | 50,000 | 2 | 4.699 |
Each tenfold step in x adds exactly 2 to log10(y), so the slope is 2, the exponent. Reading an exponent off a log-log chart means counting how many decades y moves for each decade of x.
Scaling laws, as the papers show them
Kaplan et al. posted "Scaling Laws for Neural Language Models" to arXiv on January 23, 2020. Their abstract says test loss scales as a power law with model size, dataset size and training compute, "with some trends spanning more than seven orders of magnitude". A straight line over seven decades is only readable on log axes.
For compute, their equation 1.3 is L(C_min) = (C_c / C_min)^0.050, with C_c about 3.1 x 10^8 PF-days. Loss is cross-entropy in nats, and one PF-day is 8.64 x 10^19 floating-point operations. They report the relation holds across eight orders of magnitude in compute.
Take log10 of both sides and log10(L) = 0.050 x log10(C_c) - 0.050 x log10(C). On a log-log plot that is a straight line sloping down at 0.050. The next table plugs compute increases into that exponent, which is our arithmetic on their fitted value.
Table 2. What a power-law exponent of 0.050 buys
| Compute multiplied by | Loss multiplied by | Loss falls by |
|---|---|---|
| 2 | 0.966 | 3.4% |
| 10 | 0.891 | 10.9% |
| 100 | 0.794 | 20.6% |
| 1,000 | 0.708 | 29.2% |
| 10,000 | 0.631 | 36.9% |
| 100,000,000 | 0.398 | 60.2% |
A slope of 0.050 looks nearly flat, yet eight orders of magnitude of compute cuts loss by about 60%. Each tenfold step buys the same relative cut of roughly 11%, so the compute bill grows by multiples while the gain per step stays constant. A log axis shows both facts at once.
For model size the paper states that doubling parameters gives a loss smaller by a factor 2^-0.076 = 0.95. Our arithmetic agrees, at 0.9487.
What the authors say about the limits
Two caveats matter when you read any scaling chart. Kaplan et al. observe "no signs of deviation" from straight power-law trends at large scale, but say the trends "must eventually level off" because natural language has non-zero entropy. And their section "Contradictions and a Conjecture" says two of their own fitted equations conflict at scales several orders of magnitude above their data, so the laws must break down before that point.
A straight log-log line describes the range that was measured. Extending it ten more decades is a forecast, not a measurement. Our benchmarks explainer applies the same label-everything discipline to vendor scores.
Hoffmann et al. and the slope that changed
Hoffmann et al. posted "Training Compute-Optimal Large Language Models" on March 29, 2022. They trained over 400 models from 70 million to over 16 billion parameters on 5 to 500 billion tokens and fitted how the best model size and token count grow with compute, N_opt proportional to C^a and D_opt proportional to C^b. Their first approach gives a = 0.50 and b = 0.50, and their Table 2 lists the Kaplan et al. values as 0.73 and 0.27. Slopes compound, as this arithmetic on those exponents shows.
Table 3. How the optimal model size grows with compute
| Compute multiplied by | Model size, a = 0.50 (Hoffmann, approach 1) | Model size, a = 0.73 (Kaplan, as listed by Hoffmann) |
|---|---|---|
| 10 | 3.2 times | 5.4 times |
| 100 | 10 times | 28.8 times |
| 1,000 | 31.6 times | 154.9 times |
A small slope difference becomes a 15-fold gap after three decades of compute, so a log-log line should always come with its exponent.
We cross-checked the paper against itself. Its Table 3 lists a 67 billion parameter model at 5.76 x 10^23 FLOPs and a 175 billion parameter model at 3.85 x 10^24 FLOPs. Compute rises 6.68 times and model size 2.61 times, so the implied exponent is log(2.61) / log(6.68) = 0.505, matching the headline 0.50.
Their test model, Chinchilla, has 70 billion parameters trained on 1.4 trillion tokens, with the same compute as Gopher at 280 billion parameters and 300 billion tokens. The abstract reports it beating Gopher and larger models, with 67.5% on MMLU, over 7% above Gopher. That is the authors' own result and we did not rerun it.
Turn per-token charts into per-job costs
Oakgen's pricing calculator shows credit costs by model and setting, so you can price an image, video or audio job instead of guessing from a token chart.
Price per token, the chart that falls off a cliff
Epoch AI's data insight "LLM inference prices have fallen rapidly but unequally across tasks", dated March 12, 2025 in its page metadata, tracks the cheapest model that matches a fixed benchmark score over time. The headline range is a price drop of 9 to 900 times a year depending on the benchmark and threshold, with a median of 50 times a year. Its chart uses a log price axis, with ticks at 0.1, 1, 10 and 100 dollars per million tokens.
Epoch fitted a log-linear model of price against release date because it had a much lower Bayesian Information Criterion than a linear one. In plain words, a straight line on a log price axis fit better. Here is the "GPT-3 level or better on MMLU" series from Epoch's table, with ratios and logarithms added by us.
Table 4. Cheapest qualifying price per million tokens, selected rows
| Model and date | Price (Epoch) | Cheaper than the first row by | log10(price) |
|---|---|---|---|
| GPT-3, Nov 20 2021 | $60.00 | 1 times | 1.778 |
| GPT-3.5 Turbo, Mar 6 2023 | $2.00 | 30 times | 0.301 |
| Llama-2-Chat-13B, Jul 18 2023 | $0.56 | 107 times | -0.252 |
| Llama-3.1-Instruct-8B, Jul 23 2024 | $0.10 | 600 times | -1.000 |
| Gemini-1.5-Flash-8B, Oct 3 2024 | $0.07 | 857 times | -1.155 |
From $60 to $0.07 is a factor of 857, or log10(857) = 2.93 decades. Over 1,048 days (2.87 years) a steady rate would be 857^(1/2.87), about 10.5 times a year, near the slow end of Epoch's 9 to 900 range. That is our rough two-point estimate, not Epoch's regression, and the series changes model families along the way.
Epoch lists limits worth keeping. The fastest declines, up to 900 times a year, started after January 2024, and "it's less clear that those will persist". Its prices are a 3 to 1 blend of input and output prices, and it excluded reasoning models because they generate many more tokens, which makes price per token misleading for them. That is why a token price is not a task price. See our Fable 5.2 cost per task post for how the same list price produces very different bills, and code execution with MCP for another case where token counts, not list prices, drive the bill.
On a log price axis the useful reading is the slope. A fall of 50 times a year is 1.7 decades a year, since log10(50) = 1.699, or one tenfold drop about every 7 months.
Context length, the chart where log2 helps
Epoch AI's June 25, 2025 data insight reports that since mid-2023 the longest LLM context windows have grown about 30 times a year, with a 90% confidence interval of 10 to 50 times. Its method fits release date against the log of context window length for models in the top 10 at release.
In doublings, log2(30) = 4.91 a year, so one doubling roughly every 74 days, or 2.4 months. In decades, log10(30) = 1.48 a year. Here are four rows from Epoch's dataset with the log arithmetic added by us.
Table 5. Frontier context windows, from Epoch's dataset
| Model, release date | Context window (tokens) | log2 | log10 |
|---|---|---|---|
| GPT-4, Jun 13 2023 | 8,000 | 12.97 | 3.903 |
| Claude 2, Jul 11 2023 | 100,000 | 16.61 | 5.000 |
| Gemini 1.5 Pro, May 24 2024 | 2,000,000 | 20.93 | 6.301 |
| Llama 4 Scout, Apr 5 2025 | 10,000,000 | 23.25 | 7.000 |
From GPT-4 to Gemini 1.5 Pro, log2 rises from 12.97 to 20.93, almost exactly 8 doublings in 346 days, one every 43 days. That is faster than the 30 times a year fit, a reminder that a fit through the top 10 models smooths out jumps.
A bigger window is not a usable one. The same Epoch page reports that on two long-context benchmarks the input length at which top models reach 80% accuracy rose more than 250 times in nine months, with a wide interval because the data spans under a year, and it says many real tasks are likely harder than those benchmarks. "Window size" and "length the model uses well" are different lines.
Training compute and benchmark scores
Compute is the x axis of nearly every scaling chart. Epoch's May 28, 2024 report says training compute for notable models grew about 4.1 times a year from 2010 to May 2024, and recommends summarizing recent growth as 4 to 5 times a year, with caveats about a frontier slowdown. Our arithmetic gives log2(4) = 2 and log2(5) = 2.32 doublings a year, a doubling every 6.0 to 5.2 months, or 0.60 to 0.70 decades a year.
Ten years at that pace is 4^10 = 1,048,576 times to 5^10 = 9,765,625 times, six to seven decades. Only a log axis holds that on one page.
Benchmark scores are different, because a percentage score has a ceiling at 100%, and a line that looks flat near the top can hide a large improvement. The fix is to plot the error rate, 100 minus the score, on a log axis. This is arithmetic, not a measured trend.
Table 6. Why the top of a score axis hides progress
| Score | Error rate | log10(error) | Points gained on the way |
|---|---|---|---|
| 50% | 50% | 1.699 | start |
| 90% | 10% | 1.000 | 40 points |
| 99% | 1% | 0.000 | 9 points |
| 99.9% | 0.1% | -1.000 | 0.9 points |
On a linear score axis the last two steps look like nothing. On a log error axis each is the same distance, a tenfold cut in mistakes. Whether that matters depends on your job, the question our benchmarks explainer asks of each score.
How to spot a misleading log chart
A log chart is honest when you can read the scale and the data covers a fair range. These are the six failures to look for.
- Unlabelled log axis. The EU Publications Office guide says the easiest fix is a "Logarithmic scale" note on the axis title, plus a label at each multiple of 10 so readers see that equal intervals mean multiplication by 10. If you cannot tell the axis is logarithmic, read the chart with caution.
- Gentle slope, huge change. A line that looks tame can mean a 10x change per step. Read the tick labels, not the angle. Datawrapper's explainer notes that equal distances on a log axis show equal growth rates, so a steady 100% a year rise draws a straight line however large the numbers get.
- Cherry-picked range. A window that starts at the best moment makes any trend look straight.
- A fit pushed past the data. Kaplan et al. warn that their own trends must level off, so distrust a dashed extension across several decades.
- Dropped zeros. A log axis cannot show zero or negative values. If the chart has fewer points than the table behind it, find out what was removed.
- Wrong quantity. Price per token is not cost per task, and window size is not usable length.
Mixed panels, one log and one linear, also invite comparing slopes that mean different things.
The original asset, a checklist for reading an AI chart
We built this checklist from the sections above. Use it with Table 1.
Table 7. How to read an AI chart in ten checks
| # | Check | What to do | Example from this post |
|---|---|---|---|
| 1 | Which axes are logarithmic? | Look for 1, 10, 100 ticks or a "log" label | Epoch price chart has log y |
| 2 | What is the base? | Equal steps of 10 or of 2 | Context charts often suit log2 |
| 3 | Is the line straight on log-y only, or log-log? | Log-y is exponential, log-log is a power law | Price falls vs loss against compute |
| 4 | What is the slope? | Convert to a factor per step with Table 1 | 0.050 exponent in Table 2 |
| 5 | What is the range? | Count the decades the data covers | Kaplan, eight decades of compute |
| 6 | Where does the fit stop? | Mark where measured data ends | Kaplan, trends must level off |
| 7 | Who ran the fit? | Name the publisher, date and sample | Epoch, 36 price observations |
| 8 | What is excluded? | Read the method notes | Epoch left out reasoning models |
| 9 | Is it the quantity you care about? | Task cost, usable length, error rate | Table 6 |
| 10 | Does the same story hold on a linear axis? | Redraw two points and compare | Table 4, $60 to $0.07 |
Check 7 pays off. Epoch's price page says 9 of its 36 unique observations came from its own database of API prices, for GPT-3, GPT-3.5 and Llama 2.
What I would do
Run checks 1 to 4 on any report before reading its headline. Treat a trend as a planning range, not a promise. When you quote one, give the factor per year, the dates and the caveat. When you draw your own, label the axis, show powers of ten and put the linear version beside it for new readers. I would not use a log chart to decide about a single task, since a line through many models describes the group and your workload is one point.
An honest Oakgen note. Oakgen is our product, and its image, video and audio models are priced per image, per second, per character or per run in credits, not per token. A per-token chart is the wrong lens for them, so we point you to the model pages and the calculator.
See what a creative job costs, not what a token costs
Compare plans and credit prices, then price your own image, video or audio job in the calculator before you commit.
Common mistakes
- Reading the angle, not the ticks. A slope of 0.050 and a slope of 2 can both look like diagonals.
- Adding when you should multiply. Two ticks up on a base-10 axis is 100 times, not 20.
- Treating 100 to 101 like 1 to 2. On a log axis one is 1% and the other is 100%.
- Calling every straight line exponential. On log-log it is a power law. On log y only, it is exponential.
- Quoting a trend without its range and interval. Epoch's 30 times a year has a 90% interval of 10 to 50 times.
Decision framework
| Your question | Use this axis | Why |
|---|---|---|
| How fast is something growing or falling per year? | Log y, linear x | Slope equals the yearly factor |
| How does outcome scale with size, data or compute? | Log-log | Slope equals the power-law exponent |
| How many doublings are there? | Log2 | Each tick is one doubling |
| What is the absolute gap between two values? | Linear | Log axes hide absolute differences |
| How close is a score to perfect? | Log of error rate | Equal steps are equal cuts in mistakes |
Plan a job with an agent and approve the cost first
Describe the job in Oakgen Agent Chat, review the plan and approve the credit cost before anything generates.
Frequently asked questions
What is a logarithm in simple terms?
A logarithm counts how many times you multiply a base number to reach a value. The base-10 logarithm of 1,000 is 3, because 10 x 10 x 10 = 1,000. The base-2 logarithm of 8 is 3, because 2 x 2 x 2 = 8. OpenStax's college algebra text defines the logarithm as the power to which you raise the base to get the number. That is why logarithms turn multiplication into addition, and why a chart axis built on them gives equal space to equal ratios.
Why do AI charts use log scales?
The quantities span many orders of magnitude and change by multiples, not by fixed amounts. Training compute has grown 4 to 5 times a year according to Epoch AI's May 2024 report, and LLM context windows about 30 times a year by Epoch's June 2025 estimate. On a linear axis the early years collapse into a flat line at the bottom. On a log axis each tenfold step gets the same distance, so steady multiplication shows as a straight line and a change in the growth rate shows as a bend.
How do I read a doubling on a log2 axis?
Each major tick is twice the one before, so one tick up means the value doubled. The number of ticks between two values is the base-2 logarithm of their ratio. A context window that grows from 8,000 to 2,000,000 tokens is a 250 times increase, and log2 of 250 is about 7.97, so it climbed roughly eight ticks, or eight doublings. If the axis is log10 instead, a doubling is only 0.301 of one decade, about 30 percent of the gap between the 1 and 10 gridlines.
What does a straight line on a log-log chart mean?
It means the two quantities follow a power law, y = c times x to the power k, and the slope of the line equals k. Kaplan et al. (2020) report that language-model test loss falls as a power law in training compute, with an exponent of about 0.050 in their fit, so the line slopes down gently at 0.050 decades of loss per decade of compute. A straight line on a chart with only the y axis logarithmic means steady exponential growth instead, such as a constant yearly price drop.
How can I tell a log chart is misleading?
Check six things. Is the axis labelled as logarithmic with the tick values shown? Are the ticks evenly spaced powers of 10 or 2? Does the range cover only the part of the data that looks best? Is a fitted line being extended far beyond the data? Is the quantity a price per token when the cost per task is what you care about? Are two panels mixing log and linear axes? A log axis can also never show zero, so a chart that drops zero values has quietly removed data.
Do scaling laws mean AI models will keep improving forever?
No. Kaplan et al. (2020) say they saw no deviation from straight power-law trends at the scales they tested, but that the trends must eventually level off because natural language has non-zero entropy. They also describe an apparent contradiction between two of their own fits at scales several orders of magnitude beyond their data, which implies the laws break down before that point. A straight line on a log-log plot describes the range that was measured, not a guarantee beyond it.
Is a falling price per token the same as falling cost per task?
Not always. Epoch AI's March 2025 analysis of inference prices found price per token for a fixed benchmark score falling between 9 and 900 times a year, with a median of 50 times, but it excluded reasoning models from the per-token analysis. Epoch's methodology notes say reasoning models generate many more tokens, so comparing them to other models on price per token at a given performance level is misleading. Check cost per task, not only cost per token.
Sources
- Kaplan et al., Scaling Laws for Neural Language Models, arXiv 2001.08361, Jan 23 2020 (read 2026-11-12)
- Kaplan et al., Scaling Laws for Neural Language Models, full text HTML (read 2026-11-12)
- Hoffmann et al., Training Compute-Optimal Large Language Models, arXiv 2203.15556, Mar 29 2022 (read 2026-11-12)
- Hoffmann et al., Training Compute-Optimal Large Language Models, full text HTML (read 2026-11-12)
- Epoch AI, LLM inference prices have fallen rapidly but unequally across tasks, Mar 12 2025 (read 2026-11-12)
- Epoch AI, LLMs now accept longer inputs, and the best models can use them more effectively, Jun 25 2025 (read 2026-11-12)
- Epoch AI, context window dataset (CSV) behind the Jun 25 2025 data insight (read 2026-11-12)
- Sevilla and Roldan, Epoch AI, Training compute of frontier AI models grows by 4-5x per year, May 28 2024 (read 2026-11-12)
- OpenStax, College Algebra with Corequisite Support 2e, section 6.3 Logarithmic Functions (read 2026-11-12)
- Datawrapper Blog, How to read a log scale: Growth rate, May 31 2018 (read 2026-11-12)
- GraphPad Prism user guide, When to use a logarithmic axis (read 2026-11-12)
- European Union Publications Office, Data Visualisation Guide, Logarithmic scales (read 2026-11-12)

